Good Ancestor / Emergency Communications
A common picture, held in advance

Maps for when the picture goes dark.

Coordination fails without shared situational awareness — of the storm moving in, of a crisis as it unfolds, of the cables a country's connectivity hangs from. A good map, seen and cached before the connection drops, keeps informing decisions after it. These are the maps this program publishes: built on open data, made to work offline, and served from the same stations and archives as everything else here.

The map family

Three maps, one habit: look before you lose the link.

The infrastructure map is the first to reach a public domain; the other two will be linked from this page as they come online — no placeholder links in the meantime. The images below are the maps themselves, captured from working builds, not stock art.
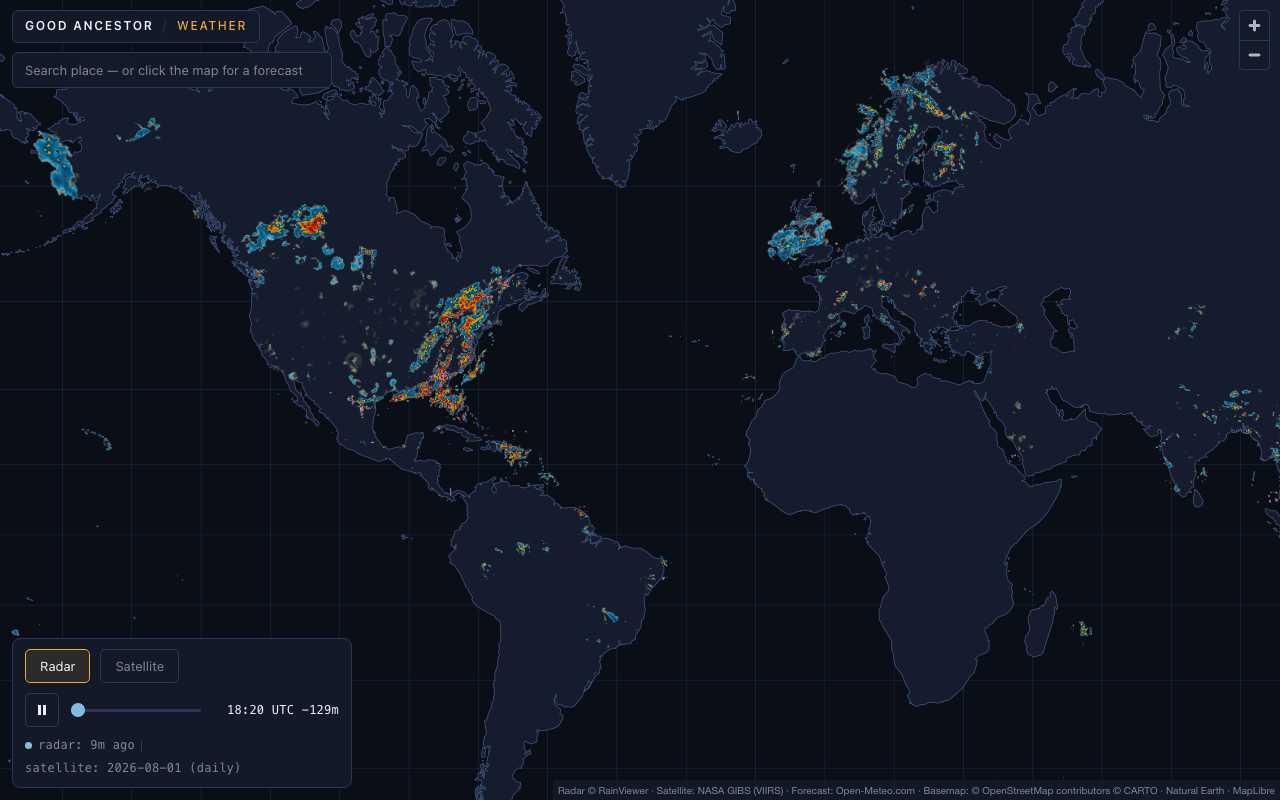
Dark world map with live precipitation radar clusters over the continents and a radar playback control.
The map itself — global radar, live data.
01 Weather · global

Global weather map

Current conditions and forecast layers for the whole planet, built from open meteorological data — the picture you check before a storm makes landfall, designed to be cached and re-served locally when the forecast matters most and the connection doesn't hold.

Coming online
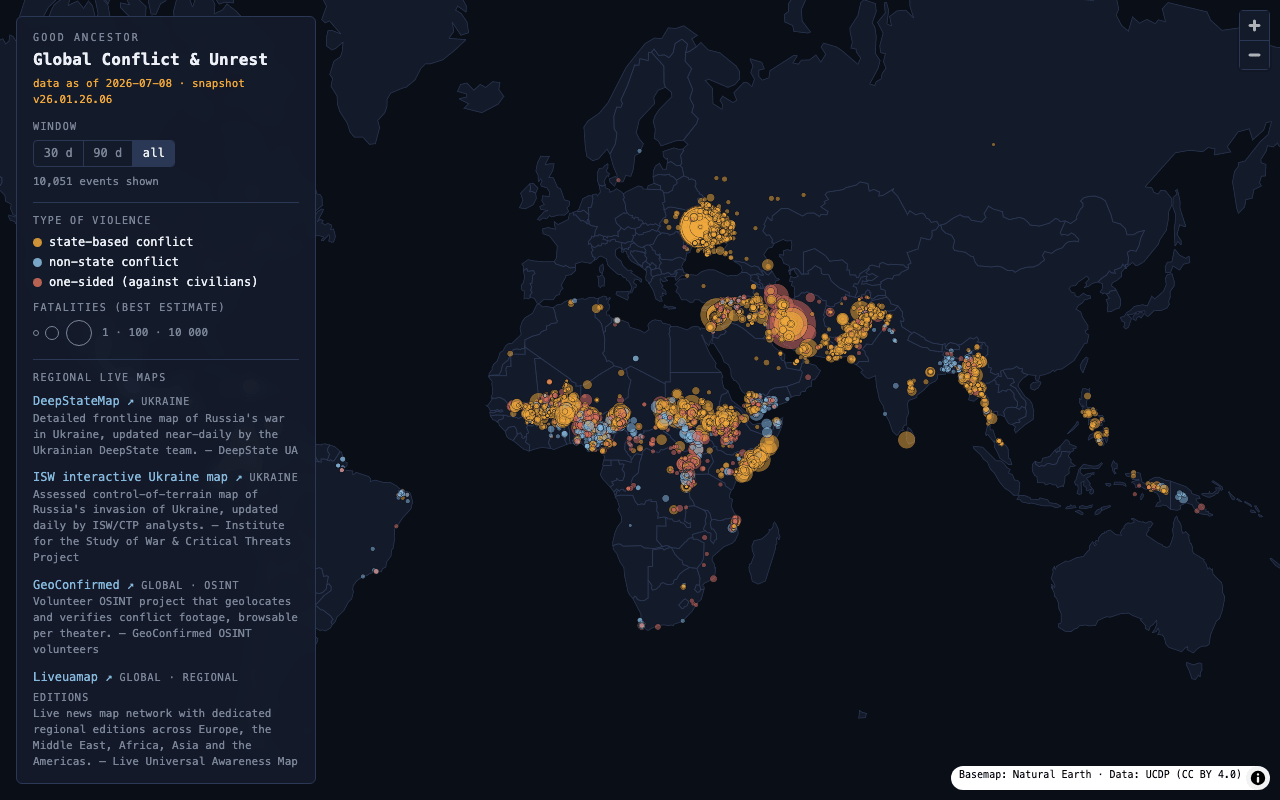
Dark world map with sized, colour-coded circles marking organized-violence events, beside a filter panel.
The map itself — reviewed event snapshot.
02 Conflict zones

Conflict-zone maps

Maps of regions where connectivity is contested or cut. Each is made with organizations from the region it covers and published in that region's language first, so the people a map describes are the people it serves. Regions are named here only when a map is ready to publish.

Coming online
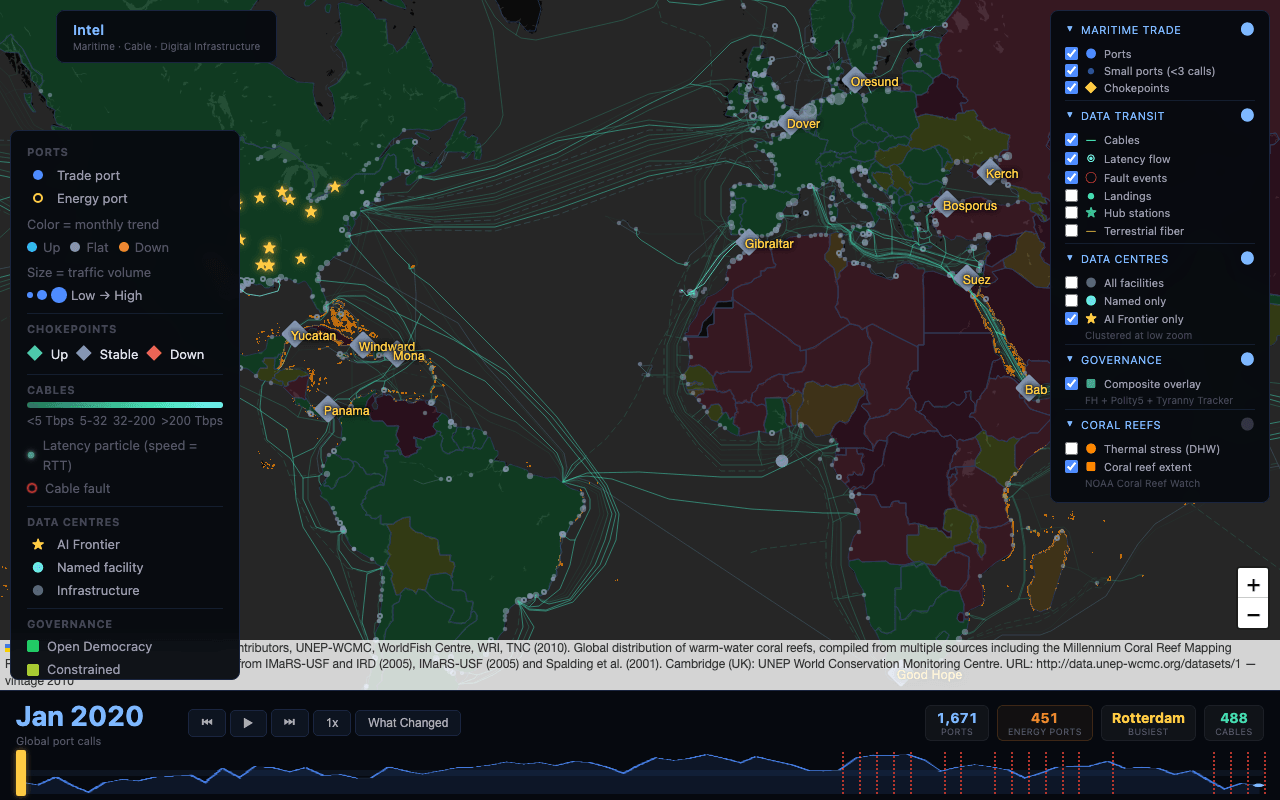
Dark world map of submarine cables, ports and chokepoints, with layer controls and a monthly timeline.
The map itself — cables, ports, chokepoints.
03 Infrastructure

Infrastructure map

Where the internet physically lives: submarine cables, their landing points, and the chokepoints where a few failures can cut off whole regions — an open reference for understanding what a region's connectivity actually hangs from, built from public infrastructure data.

Public edition · opening now
Why maps, here

A map is a message that survives the outage.

Most of what this program builds is a way to move information when the usual paths fail — a station, an archive, a satellite. Maps are the information worth moving first. They compress a complicated situation into something a group of people can point at together, and they stay useful as a cached copy long after the server that drew them is unreachable.

So each map is built to the same rules as the rest of the system: open data sources, documented terms, no account required to read, and a form that a comms station or an Archive copy can carry and serve on a local network.

They also share one engine: an open-source map toolkit — a portable pack format, a static builder, and a moderation service for community-submitted reports — so a new map for a new crisis is a data pack, not a new codebase. The toolkit's source is published alongside the first maps as they come online.

Built to travel

Dataopen sources
Accessno account
Offlinecache + re-serve
Languagelocal-first
Codeopen-source toolkit

Want to help with data curation, cartography, or translation? See how to contribute.